Hallo, liebe HardwareLUXXer,
vor ein paar Wochen habe ich mir einen neuen Compi eigenhändig zusammengestellt. Ohne weitere Fehlermeldungen laufen Win-11, Spiele, etc. relativ problemlos drauf. Allerdings bricht der Sound immer wieder ein, so dass es zu ~3s langen starken Verzerrungen/Rauschen über verschiedene Lautsprecher kommt. Vieles habe ich schon versucht (siehe Liste). Anfangs hielt ich einen Defekt in der Hardware für den Übeltäter. Nach Durchforsten dieses Forums, bin ich draufgekommen, das hilfreiche und aussagekräftige Tool LatencyMon laufen zu lassen (siehe unten). Leider bin ich für die Interpretation des LatencyMon nicht kompetent genug. ;-)
Ich würde mich riesig freuen, wenn Ihr mir bei der Fehlersuche und Identifikation der Sound-Aussetzer helfen würdet.
1000 Dank!
-Torti
PC-Komponenten
Sound-Check
LATENCYMON
vor ein paar Wochen habe ich mir einen neuen Compi eigenhändig zusammengestellt. Ohne weitere Fehlermeldungen laufen Win-11, Spiele, etc. relativ problemlos drauf. Allerdings bricht der Sound immer wieder ein, so dass es zu ~3s langen starken Verzerrungen/Rauschen über verschiedene Lautsprecher kommt. Vieles habe ich schon versucht (siehe Liste). Anfangs hielt ich einen Defekt in der Hardware für den Übeltäter. Nach Durchforsten dieses Forums, bin ich draufgekommen, das hilfreiche und aussagekräftige Tool LatencyMon laufen zu lassen (siehe unten). Leider bin ich für die Interpretation des LatencyMon nicht kompetent genug. ;-)
Ich würde mich riesig freuen, wenn Ihr mir bei der Fehlersuche und Identifikation der Sound-Aussetzer helfen würdet.
1000 Dank!
-Torti
PC-Komponenten
Gigabyte Z790 Master
I9-13900K
G.Skill 64GB DDR5-5600
Corsair MP600 PRO XT
Gigabyte RTX-4070 Ti Master
Seasonic Prime TX-1000
Arctic Liquid Freezer II 360
Fractal Design Define 7
Windows 11
I9-13900K
G.Skill 64GB DDR5-5600
Corsair MP600 PRO XT
Gigabyte RTX-4070 Ti Master
Seasonic Prime TX-1000
Arctic Liquid Freezer II 360
Fractal Design Define 7
Windows 11
Sound-Check
Hardware
-----------
- Lautsprecher: Z4 <-> Z623
- Soundkarte: SoundBlaster Z
- Gimmick: RGB deaktiviert
- Steckdosen: andere Stromquelle
- Netzteil: Seasonic Hybrid-Mode
- RAM: G.Skill ohne XMP
- Grafikarte: 600 W über 2 PCIe
- Gehäuse: Abstandshalter Check
- Anschluss: Front-Panel Check, Audio Front Anschluss trennen
- Kabel: symmetrisches Kabel, Mantelstromfilter
LATENCYMON
_________________________________________________________________________________________________________
CONCLUSION
_________________________________________________________________________________________________________
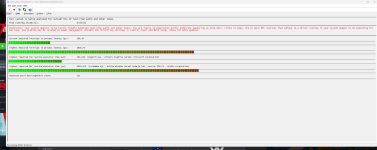
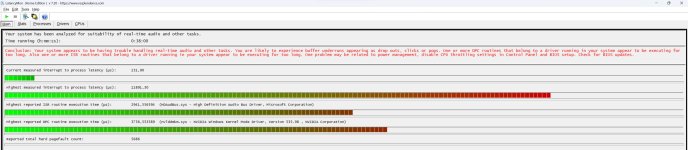
Your system appears to be having trouble handling real-time audio and other tasks. You are likely to experience buffer underruns appearing as drop outs, clicks or pops. One or more DPC routines that belong to a driver running in your system appear to be executing for too long. Also one or more ISR routines that belong to a driver running in your system appear to be executing for too long. One problem may be related to power management, disable CPU throttling settings in Control Panel and BIOS setup. Check for BIOS updates.
LatencyMon has been analyzing your system for 0:38:00 (h:mm:ss) on all processors.
_________________________________________________________________________________________________________
SYSTEM INFORMATION
_________________________________________________________________________________________________________
Computer name: GIGABYTE-Z790
OS version: Windows 11, 10.0, version 2009, build: 22621 (x64)
Hardware: Z790 AORUS MASTER, Gigabyte Technology Co., Ltd.
BIOS: F7
CPU: GenuineIntel 13th Gen Intel(R) Core(TM) i9-13900K
Logical processors: 32
Processor groups: 1
Processor group size: 32
RAM: 65374 MB total
_________________________________________________________________________________________________________
CPU SPEED
_________________________________________________________________________________________________________
Reported CPU speed (WMI): 30 MHz
Reported CPU speed (registry): 2995 MHz
Note: reported execution times may be calculated based on a fixed reported CPU speed. Disable variable speed settings like Intel Speed Step and AMD Cool N Quiet in the BIOS setup for more accurate results.
_________________________________________________________________________________________________________
MEASURED INTERRUPT TO USER PROCESS LATENCIES
_________________________________________________________________________________________________________
The interrupt to process latency reflects the measured interval that a usermode process needed to respond to a hardware request from the moment the interrupt service routine started execution. This includes the scheduling and execution of a DPC routine, the signaling of an event and the waking up of a usermode thread from an idle wait state in response to that event.
Highest measured interrupt to process latency (µs): 11891,30
Average measured interrupt to process latency (µs): 11,45090
Highest measured interrupt to DPC latency (µs): 671,20
Average measured interrupt to DPC latency (µs): 2,145774
_________________________________________________________________________________________________________
REPORTED ISRs
_________________________________________________________________________________________________________
Interrupt service routines are routines installed by the OS and device drivers that execute in response to a hardware interrupt signal.
Highest ISR routine execution time (µs): 2941,556594
Driver with highest ISR routine execution time: HDAudBus.sys - High Definition Audio Bus Driver, Microsoft Corporation
Highest reported total ISR routine time (%): 0,006043
Driver with highest ISR total time: dxgkrnl.sys - DirectX Graphics Kernel, Microsoft Corporation
Total time spent in ISRs (%) 0,007069
ISR count (execution time <250 µs): 138615
ISR count (execution time 250-500 µs): 0
ISR count (execution time 500-1000 µs): 321
ISR count (execution time 1000-2000 µs): 1
ISR count (execution time 2000-4000 µs): 2
ISR count (execution time >=4000 µs): 0
_________________________________________________________________________________________________________
REPORTED DPCs
_________________________________________________________________________________________________________
DPC routines are part of the interrupt servicing dispatch mechanism and disable the possibility for a process to utilize the CPU while it is interrupted until the DPC has finished execution.
Highest DPC routine execution time (µs): 3756,553589
Driver with highest DPC routine execution time: nvlddmkm.sys - NVIDIA Windows Kernel Mode Driver, Version 535.98 , NVIDIA Corporation
Highest reported total DPC routine time (%): 0,003797
Driver with highest DPC total execution time: ntoskrnl.exe - NT Kernel & System, Microsoft Corporation
Total time spent in DPCs (%) 0,010697
DPC count (execution time <250 µs): 611496
DPC count (execution time 250-500 µs): 0
DPC count (execution time 500-10000 µs): 1872
DPC count (execution time 1000-2000 µs): 13
DPC count (execution time 2000-4000 µs): 14
DPC count (execution time >=4000 µs): 0
_________________________________________________________________________________________________________
REPORTED HARD PAGEFAULTS
_________________________________________________________________________________________________________
Hard pagefaults are events that get triggered by making use of virtual memory that is not resident in RAM but backed by a memory mapped file on disk. The process of resolving the hard pagefault requires reading in the memory from disk while the process is interrupted and blocked from execution.
NOTE: some processes were hit by hard pagefaults. If these were programs producing audio, they are likely to interrupt the audio stream resulting in dropouts, clicks and pops. Check the Processes tab to see which programs were hit.
Process with highest pagefault count: chrome.exe
Total number of hard pagefaults 5686
Hard pagefault count of hardest hit process: 942
Number of processes hit: 42
CONCLUSION
_________________________________________________________________________________________________________
Your system appears to be having trouble handling real-time audio and other tasks. You are likely to experience buffer underruns appearing as drop outs, clicks or pops. One or more DPC routines that belong to a driver running in your system appear to be executing for too long. Also one or more ISR routines that belong to a driver running in your system appear to be executing for too long. One problem may be related to power management, disable CPU throttling settings in Control Panel and BIOS setup. Check for BIOS updates.
LatencyMon has been analyzing your system for 0:38:00 (h:mm:ss) on all processors.
_________________________________________________________________________________________________________
SYSTEM INFORMATION
_________________________________________________________________________________________________________
Computer name: GIGABYTE-Z790
OS version: Windows 11, 10.0, version 2009, build: 22621 (x64)
Hardware: Z790 AORUS MASTER, Gigabyte Technology Co., Ltd.
BIOS: F7
CPU: GenuineIntel 13th Gen Intel(R) Core(TM) i9-13900K
Logical processors: 32
Processor groups: 1
Processor group size: 32
RAM: 65374 MB total
_________________________________________________________________________________________________________
CPU SPEED
_________________________________________________________________________________________________________
Reported CPU speed (WMI): 30 MHz
Reported CPU speed (registry): 2995 MHz
Note: reported execution times may be calculated based on a fixed reported CPU speed. Disable variable speed settings like Intel Speed Step and AMD Cool N Quiet in the BIOS setup for more accurate results.
_________________________________________________________________________________________________________
MEASURED INTERRUPT TO USER PROCESS LATENCIES
_________________________________________________________________________________________________________
The interrupt to process latency reflects the measured interval that a usermode process needed to respond to a hardware request from the moment the interrupt service routine started execution. This includes the scheduling and execution of a DPC routine, the signaling of an event and the waking up of a usermode thread from an idle wait state in response to that event.
Highest measured interrupt to process latency (µs): 11891,30
Average measured interrupt to process latency (µs): 11,45090
Highest measured interrupt to DPC latency (µs): 671,20
Average measured interrupt to DPC latency (µs): 2,145774
_________________________________________________________________________________________________________
REPORTED ISRs
_________________________________________________________________________________________________________
Interrupt service routines are routines installed by the OS and device drivers that execute in response to a hardware interrupt signal.
Highest ISR routine execution time (µs): 2941,556594
Driver with highest ISR routine execution time: HDAudBus.sys - High Definition Audio Bus Driver, Microsoft Corporation
Highest reported total ISR routine time (%): 0,006043
Driver with highest ISR total time: dxgkrnl.sys - DirectX Graphics Kernel, Microsoft Corporation
Total time spent in ISRs (%) 0,007069
ISR count (execution time <250 µs): 138615
ISR count (execution time 250-500 µs): 0
ISR count (execution time 500-1000 µs): 321
ISR count (execution time 1000-2000 µs): 1
ISR count (execution time 2000-4000 µs): 2
ISR count (execution time >=4000 µs): 0
_________________________________________________________________________________________________________
REPORTED DPCs
_________________________________________________________________________________________________________
DPC routines are part of the interrupt servicing dispatch mechanism and disable the possibility for a process to utilize the CPU while it is interrupted until the DPC has finished execution.
Highest DPC routine execution time (µs): 3756,553589
Driver with highest DPC routine execution time: nvlddmkm.sys - NVIDIA Windows Kernel Mode Driver, Version 535.98 , NVIDIA Corporation
Highest reported total DPC routine time (%): 0,003797
Driver with highest DPC total execution time: ntoskrnl.exe - NT Kernel & System, Microsoft Corporation
Total time spent in DPCs (%) 0,010697
DPC count (execution time <250 µs): 611496
DPC count (execution time 250-500 µs): 0
DPC count (execution time 500-10000 µs): 1872
DPC count (execution time 1000-2000 µs): 13
DPC count (execution time 2000-4000 µs): 14
DPC count (execution time >=4000 µs): 0
_________________________________________________________________________________________________________
REPORTED HARD PAGEFAULTS
_________________________________________________________________________________________________________
Hard pagefaults are events that get triggered by making use of virtual memory that is not resident in RAM but backed by a memory mapped file on disk. The process of resolving the hard pagefault requires reading in the memory from disk while the process is interrupted and blocked from execution.
NOTE: some processes were hit by hard pagefaults. If these were programs producing audio, they are likely to interrupt the audio stream resulting in dropouts, clicks and pops. Check the Processes tab to see which programs were hit.
Process with highest pagefault count: chrome.exe
Total number of hard pagefaults 5686
Hard pagefault count of hardest hit process: 942
Number of processes hit: 42
Anhänge
Zuletzt bearbeitet:
") )
) . Solltest Du neu installieren, würde ich dazu raten, im Anschluss ein Image vom Systemlaufwerk zu erstellen; so haste schön was in der Hinterhand....