SiSoftware Sandra
Benchmark Results
Aggregate Inter-Thread Bandwidth : 165.38GB/s
Results Interpretation : Higher Scores mean Better Performance.
Binary Numeral System (base 2) : 1GB(/s) = 1024MB(/s), 1MB(/s) = 1024kB(/s), 1kB(/s) = 1024 bytes(/s), etc.
Benchmark Results
Average Inter-Thread Latency : 39.1ns (10.2ns - 54.0ns)
Inter-Thread (same Core) Latency : 10.7ns
Inter-Core (same Module) Latency : 31.6ns
Inter-LITTLE-cores (same Module) Latency : 46.6ns
Inter-big/LITTLE-Core (same Module) Latency : 39.7ns
Results Interpretation : Lower Scores mean Better Performance.
Decimal Numeral System (base 10) : 1s = 1000ms, 1ms = 1000µs, 1µs = 1000ns, etc.
Performance per Thread
Aggregate Inter-Thread Bandwidth : 5.17GB/s
No. Threads : 32
Results Interpretation : Higher Scores mean Better Performance.
Binary Numeral System (base 2) : 1GB(/s) = 1024MB(/s), 1MB(/s) = 1024kB(/s), 1kB(/s) = 1024 bytes(/s), etc.
Performance vs. Power
Processor(s) Power : 150.00W
Aggregate Inter-Thread Bandwidth : 1129.02MB/s/W
Results Interpretation : Higher Scores mean Better Performance.
Average Inter-Thread Latency : 2.61ns/W
Results Interpretation : Lower Scores mean Better Performance.
Capacity vs. Power
Total Cache Size : 469.33kB/W
Results Interpretation : Higher Scores mean Better Performance.
Performance vs. Speed
Aggregate Inter-Thread Bandwidth : 29.32MB/s/MHz
Results Interpretation : Higher Scores mean Better Performance.
Average Inter-Thread Latency : 0.07ns/MHz
Results Interpretation : Lower Scores mean Better Performance.
Detailed Results
Processor Affinity : U0-U1 U2-U3 U4-U5 U6-U7 U8-U9 U10-U11 U12-U13 U14-U15 U16-U24 U17-U25 U18-U26 U19-U27 U20-U23 U21-U22 U28-U31 U29-U30
U0-C0T0 <> U2-C1T0 Data Latency : 31.9ns
U0-C0T0 <> U4-C2T0 Data Latency : 31.7ns
U0-C0T0 <> U6-C3T0 Data Latency : 31.4ns
U0-C0T0 <> U8-C4T0 Data Latency : 31.9ns
U0-C0T0 <> U10-C5T0 Data Latency : 33.2ns
U0-C0T0 <> U12-C6T0 Data Latency : 33.9ns
U0-C0T0 <> U14-C7T0 Data Latency : 33.9ns
U0-C0T0 <> U16-c8 Data Latency : 42.1ns
U0-C0T0 <> U17-c9 Data Latency : 42.1ns
U0-C0T0 <> U18-c10 Data Latency : 42.2ns
U0-C0T0 <> U19-c11 Data Latency : 42.5ns
U0-C0T0 <> U20-c12 Data Latency : 42.3ns
U0-C0T0 <> U21-c13 Data Latency : 42.2ns
U0-C0T0 <> U22-c14 Data Latency : 42.2ns
U0-C0T0 <> U23-c15 Data Latency : 42.1ns
U0-C0T0 <> U24-c16 Data Latency : 41.4ns
U0-C0T0 <> U25-c17 Data Latency : 41.5ns
U0-C0T0 <> U26-c18 Data Latency : 41.5ns
U0-C0T0 <> U27-c19 Data Latency : 41.5ns
U0-C0T0 <> U28-c20 Data Latency : 40.0ns
U0-C0T0 <> U29-c21 Data Latency : 40.1ns
U0-C0T0 <> U30-c22 Data Latency : 40.3ns
U0-C0T0 <> U31-c23 Data Latency : 39.9ns
U0-C0T0 <> U1-C0T1 Data Latency : 10.8ns
U0-C0T0 <> U3-C1T1 Data Latency : 31.6ns
U0-C0T0 <> U5-C2T1 Data Latency : 31.7ns
U0-C0T0 <> U7-C3T1 Data Latency : 31.4ns
U0-C0T0 <> U9-C4T1 Data Latency : 32.1ns
U0-C0T0 <> U11-C5T1 Data Latency : 33.2ns
U0-C0T0 <> U13-C6T1 Data Latency : 34.0ns
U0-C0T0 <> U15-C7T1 Data Latency : 34.1ns
U2-C1T0 <> U4-C2T0 Data Latency : 30.8ns
U2-C1T0 <> U6-C3T0 Data Latency : 31.0ns
U2-C1T0 <> U8-C4T0 Data Latency : 32.1ns
U2-C1T0 <> U10-C5T0 Data Latency : 32.7ns
U2-C1T0 <> U12-C6T0 Data Latency : 33.2ns
U2-C1T0 <> U14-C7T0 Data Latency : 33.7ns
U2-C1T0 <> U16-c8 Data Latency : 41.5ns
U2-C1T0 <> U17-c9 Data Latency : 41.5ns
U2-C1T0 <> U18-c10 Data Latency : 41.5ns
U2-C1T0 <> U19-c11 Data Latency : 41.7ns
U2-C1T0 <> U20-c12 Data Latency : 42.0ns
U2-C1T0 <> U21-c13 Data Latency : 41.8ns
U2-C1T0 <> U22-c14 Data Latency : 41.4ns
U2-C1T0 <> U23-c15 Data Latency : 41.7ns
U2-C1T0 <> U24-c16 Data Latency : 37.2ns
U2-C1T0 <> U25-c17 Data Latency : 36.6ns
U2-C1T0 <> U26-c18 Data Latency : 36.9ns
U2-C1T0 <> U27-c19 Data Latency : 37.5ns
U2-C1T0 <> U28-c20 Data Latency : 37.5ns
U2-C1T0 <> U29-c21 Data Latency : 37.3ns
U2-C1T0 <> U30-c22 Data Latency : 36.7ns
U2-C1T0 <> U31-c23 Data Latency : 37.2ns
U2-C1T0 <> U1-C0T1 Data Latency : 31.1ns
U2-C1T0 <> U3-C1T1 Data Latency : 11.7ns
U2-C1T0 <> U5-C2T1 Data Latency : 30.8ns
U2-C1T0 <> U7-C3T1 Data Latency : 31.1ns
U2-C1T0 <> U9-C4T1 Data Latency : 32.0ns
U2-C1T0 <> U11-C5T1 Data Latency : 33.3ns
U2-C1T0 <> U13-C6T1 Data Latency : 33.7ns
U2-C1T0 <> U15-C7T1 Data Latency : 34.0ns
U4-C2T0 <> U6-C3T0 Data Latency : 31.1ns
U4-C2T0 <> U8-C4T0 Data Latency : 32.2ns
U4-C2T0 <> U10-C5T0 Data Latency : 33.1ns
U4-C2T0 <> U12-C6T0 Data Latency : 33.8ns
U4-C2T0 <> U14-C7T0 Data Latency : 33.1ns
U4-C2T0 <> U16-c8 Data Latency : 42.1ns
U4-C2T0 <> U17-c9 Data Latency : 42.3ns
U4-C2T0 <> U18-c10 Data Latency : 42.2ns
U4-C2T0 <> U19-c11 Data Latency : 42.5ns
U4-C2T0 <> U20-c12 Data Latency : 41.9ns
U4-C2T0 <> U21-c13 Data Latency : 42.0ns
U4-C2T0 <> U22-c14 Data Latency : 42.1ns
U4-C2T0 <> U23-c15 Data Latency : 42.1ns
U4-C2T0 <> U24-c16 Data Latency : 37.1ns
U4-C2T0 <> U25-c17 Data Latency : 36.9ns
U4-C2T0 <> U26-c18 Data Latency : 36.7ns
U4-C2T0 <> U27-c19 Data Latency : 36.7ns
U4-C2T0 <> U28-c20 Data Latency : 36.6ns
U4-C2T0 <> U29-c21 Data Latency : 36.5ns
U4-C2T0 <> U30-c22 Data Latency : 36.8ns
U4-C2T0 <> U31-c23 Data Latency : 36.6ns
U4-C2T0 <> U1-C0T1 Data Latency : 31.7ns
U4-C2T0 <> U3-C1T1 Data Latency : 31.3ns
U4-C2T0 <> U5-C2T1 Data Latency : 11.0ns
U4-C2T0 <> U7-C3T1 Data Latency : 30.5ns
U4-C2T0 <> U9-C4T1 Data Latency : 31.7ns
U4-C2T0 <> U11-C5T1 Data Latency : 32.6ns
U4-C2T0 <> U13-C6T1 Data Latency : 32.8ns
U4-C2T0 <> U15-C7T1 Data Latency : 32.3ns
U6-C3T0 <> U8-C4T0 Data Latency : 28.5ns
U6-C3T0 <> U10-C5T0 Data Latency : 28.6ns
U6-C3T0 <> U12-C6T0 Data Latency : 29.5ns
U6-C3T0 <> U14-C7T0 Data Latency : 29.8ns
U6-C3T0 <> U16-c8 Data Latency : 36.4ns
U6-C3T0 <> U17-c9 Data Latency : 36.0ns
U6-C3T0 <> U18-c10 Data Latency : 37.5ns
U6-C3T0 <> U19-c11 Data Latency : 36.7ns
U6-C3T0 <> U20-c12 Data Latency : 36.9ns
U6-C3T0 <> U21-c13 Data Latency : 36.7ns
U6-C3T0 <> U22-c14 Data Latency : 36.8ns
U6-C3T0 <> U23-c15 Data Latency : 37.3ns
U6-C3T0 <> U24-c16 Data Latency : 38.5ns
U6-C3T0 <> U25-c17 Data Latency : 37.7ns
U6-C3T0 <> U26-c18 Data Latency : 38.6ns
U6-C3T0 <> U27-c19 Data Latency : 38.3ns
U6-C3T0 <> U28-c20 Data Latency : 39.7ns
U6-C3T0 <> U29-c21 Data Latency : 38.1ns
U6-C3T0 <> U30-c22 Data Latency : 38.2ns
U6-C3T0 <> U31-c23 Data Latency : 39.1ns
U6-C3T0 <> U1-C0T1 Data Latency : 31.0ns
U6-C3T0 <> U3-C1T1 Data Latency : 31.1ns
U6-C3T0 <> U5-C2T1 Data Latency : 30.7ns
U6-C3T0 <> U7-C3T1 Data Latency : 10.4ns
U6-C3T0 <> U9-C4T1 Data Latency : 28.1ns
U6-C3T0 <> U11-C5T1 Data Latency : 28.7ns
U6-C3T0 <> U13-C6T1 Data Latency : 29.7ns
U6-C3T0 <> U15-C7T1 Data Latency : 30.1ns
U8-C4T0 <> U10-C5T0 Data Latency : 29.3ns
U8-C4T0 <> U12-C6T0 Data Latency : 30.4ns
U8-C4T0 <> U14-C7T0 Data Latency : 30.8ns
U8-C4T0 <> U16-c8 Data Latency : 37.8ns
U8-C4T0 <> U17-c9 Data Latency : 39.0ns
U8-C4T0 <> U18-c10 Data Latency : 38.4ns
U8-C4T0 <> U19-c11 Data Latency : 38.3ns
U8-C4T0 <> U20-c12 Data Latency : 38.5ns
U8-C4T0 <> U21-c13 Data Latency : 38.2ns
U8-C4T0 <> U22-c14 Data Latency : 37.9ns
U8-C4T0 <> U23-c15 Data Latency : 37.5ns
U8-C4T0 <> U24-c16 Data Latency : 39.0ns
U8-C4T0 <> U25-c17 Data Latency : 39.4ns
U8-C4T0 <> U26-c18 Data Latency : 39.8ns
U8-C4T0 <> U27-c19 Data Latency : 39.8ns
U8-C4T0 <> U28-c20 Data Latency : 40.4ns
U8-C4T0 <> U29-c21 Data Latency : 40.6ns
U8-C4T0 <> U30-c22 Data Latency : 40.6ns
U8-C4T0 <> U31-c23 Data Latency : 39.9ns
U8-C4T0 <> U1-C0T1 Data Latency : 32.0ns
U8-C4T0 <> U3-C1T1 Data Latency : 32.1ns
U8-C4T0 <> U5-C2T1 Data Latency : 31.7ns
U8-C4T0 <> U7-C3T1 Data Latency : 28.5ns
U8-C4T0 <> U9-C4T1 Data Latency : 10.5ns
U8-C4T0 <> U11-C5T1 Data Latency : 29.3ns
U8-C4T0 <> U13-C6T1 Data Latency : 30.3ns
U8-C4T0 <> U15-C7T1 Data Latency : 30.7ns
U10-C5T0 <> U12-C6T0 Data Latency : 30.9ns
U10-C5T0 <> U14-C7T0 Data Latency : 30.9ns
U10-C5T0 <> U16-c8 Data Latency : 38.7ns
U10-C5T0 <> U17-c9 Data Latency : 37.0ns
U10-C5T0 <> U18-c10 Data Latency : 38.1ns
U10-C5T0 <> U19-c11 Data Latency : 37.8ns
U10-C5T0 <> U20-c12 Data Latency : 38.7ns
U10-C5T0 <> U21-c13 Data Latency : 37.9ns
U10-C5T0 <> U22-c14 Data Latency : 38.2ns
U10-C5T0 <> U23-c15 Data Latency : 38.6ns
U10-C5T0 <> U24-c16 Data Latency : 39.5ns
U10-C5T0 <> U25-c17 Data Latency : 40.4ns
U10-C5T0 <> U26-c18 Data Latency : 40.4ns
U10-C5T0 <> U27-c19 Data Latency : 39.5ns
U10-C5T0 <> U28-c20 Data Latency : 40.6ns
U10-C5T0 <> U29-c21 Data Latency : 39.7ns
U10-C5T0 <> U30-c22 Data Latency : 39.7ns
U10-C5T0 <> U31-c23 Data Latency : 39.6ns
U10-C5T0 <> U1-C0T1 Data Latency : 33.1ns
U10-C5T0 <> U3-C1T1 Data Latency : 32.8ns
U10-C5T0 <> U5-C2T1 Data Latency : 32.2ns
U10-C5T0 <> U7-C3T1 Data Latency : 28.9ns
U10-C5T0 <> U9-C4T1 Data Latency : 29.4ns
U10-C5T0 <> U11-C5T1 Data Latency : 10.2ns
U10-C5T0 <> U13-C6T1 Data Latency : 30.5ns
U10-C5T0 <> U15-C7T1 Data Latency : 30.9ns
U12-C6T0 <> U14-C7T0 Data Latency : 31.8ns
U12-C6T0 <> U16-c8 Data Latency : 40.0ns
U12-C6T0 <> U17-c9 Data Latency : 38.8ns
U12-C6T0 <> U18-c10 Data Latency : 39.1ns
U12-C6T0 <> U19-c11 Data Latency : 39.3ns
U12-C6T0 <> U20-c12 Data Latency : 38.4ns
U12-C6T0 <> U21-c13 Data Latency : 39.1ns
U12-C6T0 <> U22-c14 Data Latency : 38.3ns
U12-C6T0 <> U23-c15 Data Latency : 39.1ns
U12-C6T0 <> U24-c16 Data Latency : 41.2ns
U12-C6T0 <> U25-c17 Data Latency : 41.2ns
U12-C6T0 <> U26-c18 Data Latency : 40.8ns
U12-C6T0 <> U27-c19 Data Latency : 41.4ns
U12-C6T0 <> U28-c20 Data Latency : 41.7ns
U12-C6T0 <> U29-c21 Data Latency : 42.0ns
U12-C6T0 <> U30-c22 Data Latency : 41.5ns
U12-C6T0 <> U31-c23 Data Latency : 41.5ns
U12-C6T0 <> U1-C0T1 Data Latency : 33.7ns
U12-C6T0 <> U3-C1T1 Data Latency : 34.1ns
U12-C6T0 <> U5-C2T1 Data Latency : 33.0ns
U12-C6T0 <> U7-C3T1 Data Latency : 29.7ns
U12-C6T0 <> U9-C4T1 Data Latency : 30.3ns
U12-C6T0 <> U11-C5T1 Data Latency : 30.4ns
U12-C6T0 <> U13-C6T1 Data Latency : 10.9ns
U12-C6T0 <> U15-C7T1 Data Latency : 31.8ns
U14-C7T0 <> U16-c8 Data Latency : 39.2ns
U14-C7T0 <> U17-c9 Data Latency : 37.4ns
U14-C7T0 <> U18-c10 Data Latency : 39.9ns
U14-C7T0 <> U19-c11 Data Latency : 38.2ns
U14-C7T0 <> U20-c12 Data Latency : 38.5ns
U14-C7T0 <> U21-c13 Data Latency : 39.0ns
U14-C7T0 <> U22-c14 Data Latency : 40.0ns
U14-C7T0 <> U23-c15 Data Latency : 39.6ns
U14-C7T0 <> U24-c16 Data Latency : 40.8ns
U14-C7T0 <> U25-c17 Data Latency : 41.2ns
U14-C7T0 <> U26-c18 Data Latency : 41.6ns
U14-C7T0 <> U27-c19 Data Latency : 42.1ns
U14-C7T0 <> U28-c20 Data Latency : 41.9ns
U14-C7T0 <> U29-c21 Data Latency : 41.1ns
U14-C7T0 <> U30-c22 Data Latency : 40.4ns
U14-C7T0 <> U31-c23 Data Latency : 41.1ns
U14-C7T0 <> U1-C0T1 Data Latency : 33.6ns
U14-C7T0 <> U3-C1T1 Data Latency : 34.0ns
U14-C7T0 <> U5-C2T1 Data Latency : 33.4ns
U14-C7T0 <> U7-C3T1 Data Latency : 30.1ns
U14-C7T0 <> U9-C4T1 Data Latency : 30.5ns
U14-C7T0 <> U11-C5T1 Data Latency : 31.1ns
U14-C7T0 <> U13-C6T1 Data Latency : 31.8ns
U14-C7T0 <> U15-C7T1 Data Latency : 10.4ns
U16-c8 <> U17-c9 Data Latency : 47.3ns
U16-c8 <> U18-c10 Data Latency : 48.3ns
U16-c8 <> U19-c11 Data Latency : 45.7ns
U16-c8 <> U20-c12 Data Latency : 42.7ns
U16-c8 <> U21-c13 Data Latency : 42.7ns
U16-c8 <> U22-c14 Data Latency : 42.1ns
U16-c8 <> U23-c15 Data Latency : 42.2ns
U16-c8 <> U24-c16 Data Latency : 41.0ns
U16-c8 <> U25-c17 Data Latency : 46.4ns
U16-c8 <> U26-c18 Data Latency : 47.1ns
U16-c8 <> U27-c19 Data Latency : 41.4ns
U16-c8 <> U28-c20 Data Latency : 46.7ns
U16-c8 <> U29-c21 Data Latency : 48.7ns
U16-c8 <> U30-c22 Data Latency : 48.6ns
U16-c8 <> U31-c23 Data Latency : 47.3ns
U16-c8 <> U1-C0T1 Data Latency : 41.6ns
U16-c8 <> U3-C1T1 Data Latency : 41.6ns
U16-c8 <> U5-C2T1 Data Latency : 41.8ns
U16-c8 <> U7-C3T1 Data Latency : 35.9ns
U16-c8 <> U9-C4T1 Data Latency : 35.1ns
U16-c8 <> U11-C5T1 Data Latency : 37.0ns
U16-c8 <> U13-C6T1 Data Latency : 36.7ns
U16-c8 <> U15-C7T1 Data Latency : 38.0ns
U17-c9 <> U18-c10 Data Latency : 47.2ns
U17-c9 <> U19-c11 Data Latency : 48.8ns
U17-c9 <> U20-c12 Data Latency : 46.7ns
U17-c9 <> U21-c13 Data Latency : 45.9ns
U17-c9 <> U22-c14 Data Latency : 42.3ns
U17-c9 <> U23-c15 Data Latency : 45.2ns
U17-c9 <> U24-c16 Data Latency : 47.7ns
U17-c9 <> U25-c17 Data Latency : 41.1ns
U17-c9 <> U26-c18 Data Latency : 45.2ns
U17-c9 <> U27-c19 Data Latency : 48.4ns
U17-c9 <> U28-c20 Data Latency : 47.9ns
U17-c9 <> U29-c21 Data Latency : 47.4ns
U17-c9 <> U30-c22 Data Latency : 43.4ns
U17-c9 <> U31-c23 Data Latency : 41.8ns
U17-c9 <> U1-C0T1 Data Latency : 41.5ns
U17-c9 <> U3-C1T1 Data Latency : 41.7ns
U17-c9 <> U5-C2T1 Data Latency : 42.4ns
U17-c9 <> U7-C3T1 Data Latency : 36.1ns
U17-c9 <> U9-C4T1 Data Latency : 36.0ns
U17-c9 <> U11-C5T1 Data Latency : 35.2ns
U17-c9 <> U13-C6T1 Data Latency : 36.8ns
U17-c9 <> U15-C7T1 Data Latency : 38.5ns
U18-c10 <> U19-c11 Data Latency : 48.5ns
U18-c10 <> U20-c12 Data Latency : 46.7ns
U18-c10 <> U21-c13 Data Latency : 46.3ns
U18-c10 <> U22-c14 Data Latency : 46.2ns
U18-c10 <> U23-c15 Data Latency : 46.2ns
U18-c10 <> U24-c16 Data Latency : 41.7ns
U18-c10 <> U25-c17 Data Latency : 41.0ns
U18-c10 <> U26-c18 Data Latency : 41.5ns
U18-c10 <> U27-c19 Data Latency : 42.4ns
U18-c10 <> U28-c20 Data Latency : 42.0ns
U18-c10 <> U29-c21 Data Latency : 41.6ns
U18-c10 <> U30-c22 Data Latency : 41.7ns
U18-c10 <> U31-c23 Data Latency : 45.1ns
U18-c10 <> U1-C0T1 Data Latency : 41.4ns
U18-c10 <> U3-C1T1 Data Latency : 41.6ns
U18-c10 <> U5-C2T1 Data Latency : 41.6ns
U18-c10 <> U7-C3T1 Data Latency : 36.3ns
U18-c10 <> U9-C4T1 Data Latency : 35.9ns
U18-c10 <> U11-C5T1 Data Latency : 36.3ns
U18-c10 <> U13-C6T1 Data Latency : 36.4ns
U18-c10 <> U15-C7T1 Data Latency : 37.9ns
U19-c11 <> U20-c12 Data Latency : 42.0ns
U19-c11 <> U21-c13 Data Latency : 45.3ns
U19-c11 <> U22-c14 Data Latency : 45.9ns
U19-c11 <> U23-c15 Data Latency : 45.5ns
U19-c11 <> U24-c16 Data Latency : 47.8ns
U19-c11 <> U25-c17 Data Latency : 48.3ns
U19-c11 <> U26-c18 Data Latency : 48.1ns
U19-c11 <> U27-c19 Data Latency : 40.8ns
U19-c11 <> U28-c20 Data Latency : 46.1ns
U19-c11 <> U29-c21 Data Latency : 47.4ns
U19-c11 <> U30-c22 Data Latency : 47.8ns
U19-c11 <> U31-c23 Data Latency : 42.7ns
U19-c11 <> U1-C0T1 Data Latency : 41.8ns
U19-c11 <> U3-C1T1 Data Latency : 41.8ns
U19-c11 <> U5-C2T1 Data Latency : 41.8ns
U19-c11 <> U7-C3T1 Data Latency : 36.2ns
U19-c11 <> U9-C4T1 Data Latency : 37.4ns
U19-c11 <> U11-C5T1 Data Latency : 38.0ns
U19-c11 <> U13-C6T1 Data Latency : 37.8ns
U19-c11 <> U15-C7T1 Data Latency : 39.0ns
U20-c12 <> U21-c13 Data Latency : 47.2ns
U20-c12 <> U22-c14 Data Latency : 47.8ns
U20-c12 <> U23-c15 Data Latency : 46.7ns
U20-c12 <> U24-c16 Data Latency : 41.0ns
U20-c12 <> U25-c17 Data Latency : 47.0ns
U20-c12 <> U26-c18 Data Latency : 47.4ns
U20-c12 <> U27-c19 Data Latency : 45.0ns
U20-c12 <> U28-c20 Data Latency : 48.1ns
U20-c12 <> U29-c21 Data Latency : 48.0ns
U20-c12 <> U30-c22 Data Latency : 48.2ns
U20-c12 <> U31-c23 Data Latency : 48.2ns
U20-c12 <> U1-C0T1 Data Latency : 42.0ns
U20-c12 <> U3-C1T1 Data Latency : 41.7ns
U20-c12 <> U5-C2T1 Data Latency : 42.0ns
U20-c12 <> U7-C3T1 Data Latency : 36.0ns
U20-c12 <> U9-C4T1 Data Latency : 35.5ns
U20-c12 <> U11-C5T1 Data Latency : 35.0ns
U20-c12 <> U13-C6T1 Data Latency : 38.2ns
U20-c12 <> U15-C7T1 Data Latency : 38.3ns
U21-c13 <> U22-c14 Data Latency : 45.4ns
U21-c13 <> U23-c15 Data Latency : 46.9ns
U21-c13 <> U24-c16 Data Latency : 48.3ns
U21-c13 <> U25-c17 Data Latency : 46.5ns
U21-c13 <> U26-c18 Data Latency : 41.2ns
U21-c13 <> U27-c19 Data Latency : 46.1ns
U21-c13 <> U28-c20 Data Latency : 48.5ns
U21-c13 <> U29-c21 Data Latency : 48.2ns
U21-c13 <> U30-c22 Data Latency : 48.3ns
U21-c13 <> U31-c23 Data Latency : 46.4ns
U21-c13 <> U1-C0T1 Data Latency : 42.0ns
U21-c13 <> U3-C1T1 Data Latency : 41.8ns
U21-c13 <> U5-C2T1 Data Latency : 41.9ns
U21-c13 <> U7-C3T1 Data Latency : 35.8ns
U21-c13 <> U9-C4T1 Data Latency : 35.3ns
U21-c13 <> U11-C5T1 Data Latency : 37.2ns
U21-c13 <> U13-C6T1 Data Latency : 37.9ns
U21-c13 <> U15-C7T1 Data Latency : 38.6ns
U22-c14 <> U23-c15 Data Latency : 47.5ns
U22-c14 <> U24-c16 Data Latency : 49.1ns
U22-c14 <> U25-c17 Data Latency : 48.2ns
U22-c14 <> U26-c18 Data Latency : 48.5ns
U22-c14 <> U27-c19 Data Latency : 47.4ns
U22-c14 <> U28-c20 Data Latency : 48.1ns
U22-c14 <> U29-c21 Data Latency : 42.3ns
U22-c14 <> U30-c22 Data Latency : 42.4ns
U22-c14 <> U31-c23 Data Latency : 42.3ns
U22-c14 <> U1-C0T1 Data Latency : 42.0ns
U22-c14 <> U3-C1T1 Data Latency : 41.9ns
U22-c14 <> U5-C2T1 Data Latency : 42.0ns
U22-c14 <> U7-C3T1 Data Latency : 35.7ns
U22-c14 <> U9-C4T1 Data Latency : 36.5ns
U22-c14 <> U11-C5T1 Data Latency : 36.6ns
U22-c14 <> U13-C6T1 Data Latency : 38.0ns
U22-c14 <> U15-C7T1 Data Latency : 38.2ns
U23-c15 <> U24-c16 Data Latency : 41.8ns
U23-c15 <> U25-c17 Data Latency : 46.5ns
U23-c15 <> U26-c18 Data Latency : 47.2ns
U23-c15 <> U27-c19 Data Latency : 48.2ns
U23-c15 <> U28-c20 Data Latency : 47.9ns
U23-c15 <> U29-c21 Data Latency : 47.6ns
U23-c15 <> U30-c22 Data Latency : 47.8ns
U23-c15 <> U31-c23 Data Latency : 48.2ns
U23-c15 <> U1-C0T1 Data Latency : 42.1ns
U23-c15 <> U3-C1T1 Data Latency : 41.9ns
U23-c15 <> U5-C2T1 Data Latency : 42.0ns
U23-c15 <> U7-C3T1 Data Latency : 34.9ns
U23-c15 <> U9-C4T1 Data Latency : 36.0ns
U23-c15 <> U11-C5T1 Data Latency : 37.3ns
U23-c15 <> U13-C6T1 Data Latency : 37.6ns
U23-c15 <> U15-C7T1 Data Latency : 38.5ns
U24-c16 <> U25-c17 Data Latency : 52.3ns
U24-c16 <> U26-c18 Data Latency : 52.3ns
U24-c16 <> U27-c19 Data Latency : 53.3ns
U24-c16 <> U28-c20 Data Latency : 48.8ns
U24-c16 <> U29-c21 Data Latency : 43.9ns
U24-c16 <> U30-c22 Data Latency : 47.4ns
U24-c16 <> U31-c23 Data Latency : 49.3ns
U24-c16 <> U1-C0T1 Data Latency : 44.5ns
U24-c16 <> U3-C1T1 Data Latency : 44.3ns
U24-c16 <> U5-C2T1 Data Latency : 44.2ns
U24-c16 <> U7-C3T1 Data Latency : 37.8ns
U24-c16 <> U9-C4T1 Data Latency : 38.0ns
U24-c16 <> U11-C5T1 Data Latency : 37.8ns
U24-c16 <> U13-C6T1 Data Latency : 40.2ns
U24-c16 <> U15-C7T1 Data Latency : 39.2ns
U25-c17 <> U26-c18 Data Latency : 52.7ns
U25-c17 <> U27-c19 Data Latency : 52.6ns
U25-c17 <> U28-c20 Data Latency : 49.0ns
U25-c17 <> U29-c21 Data Latency : 49.4ns
U25-c17 <> U30-c22 Data Latency : 49.4ns
U25-c17 <> U31-c23 Data Latency : 44.2ns
U25-c17 <> U1-C0T1 Data Latency : 44.1ns
U25-c17 <> U3-C1T1 Data Latency : 43.9ns
U25-c17 <> U5-C2T1 Data Latency : 44.2ns
U25-c17 <> U7-C3T1 Data Latency : 37.9ns
U25-c17 <> U9-C4T1 Data Latency : 38.9ns
U25-c17 <> U11-C5T1 Data Latency : 39.3ns
U25-c17 <> U13-C6T1 Data Latency : 39.8ns
U25-c17 <> U15-C7T1 Data Latency : 39.8ns
U26-c18 <> U27-c19 Data Latency : 51.4ns
U26-c18 <> U28-c20 Data Latency : 48.3ns
U26-c18 <> U29-c21 Data Latency : 43.7ns
U26-c18 <> U30-c22 Data Latency : 44.1ns
U26-c18 <> U31-c23 Data Latency : 43.9ns
U26-c18 <> U1-C0T1 Data Latency : 44.1ns
U26-c18 <> U3-C1T1 Data Latency : 44.3ns
U26-c18 <> U5-C2T1 Data Latency : 44.1ns
U26-c18 <> U7-C3T1 Data Latency : 37.3ns
U26-c18 <> U9-C4T1 Data Latency : 37.4ns
U26-c18 <> U11-C5T1 Data Latency : 39.7ns
U26-c18 <> U13-C6T1 Data Latency : 39.3ns
U26-c18 <> U15-C7T1 Data Latency : 39.2ns
U27-c19 <> U28-c20 Data Latency : 49.2ns
U27-c19 <> U29-c21 Data Latency : 49.9ns
U27-c19 <> U30-c22 Data Latency : 48.7ns
U27-c19 <> U31-c23 Data Latency : 49.6ns
U27-c19 <> U1-C0T1 Data Latency : 44.4ns
U27-c19 <> U3-C1T1 Data Latency : 44.1ns
U27-c19 <> U5-C2T1 Data Latency : 44.3ns
U27-c19 <> U7-C3T1 Data Latency : 37.4ns
U27-c19 <> U9-C4T1 Data Latency : 39.2ns
U27-c19 <> U11-C5T1 Data Latency : 38.8ns
U27-c19 <> U13-C6T1 Data Latency : 39.1ns
U27-c19 <> U15-C7T1 Data Latency : 39.4ns
U28-c20 <> U29-c21 Data Latency : 53.2ns
U28-c20 <> U30-c22 Data Latency : 54.0ns
U28-c20 <> U31-c23 Data Latency : 49.2ns
U28-c20 <> U1-C0T1 Data Latency : 44.0ns
U28-c20 <> U3-C1T1 Data Latency : 44.0ns
U28-c20 <> U5-C2T1 Data Latency : 44.5ns
U28-c20 <> U7-C3T1 Data Latency : 37.8ns
U28-c20 <> U9-C4T1 Data Latency : 38.9ns
U28-c20 <> U11-C5T1 Data Latency : 40.4ns
U28-c20 <> U13-C6T1 Data Latency : 40.8ns
U28-c20 <> U15-C7T1 Data Latency : 41.1ns
U29-c21 <> U30-c22 Data Latency : 53.2ns
U29-c21 <> U31-c23 Data Latency : 53.6ns
U29-c21 <> U1-C0T1 Data Latency : 43.8ns
U29-c21 <> U3-C1T1 Data Latency : 44.0ns
U29-c21 <> U5-C2T1 Data Latency : 44.5ns
U29-c21 <> U7-C3T1 Data Latency : 37.7ns
U29-c21 <> U9-C4T1 Data Latency : 39.4ns
U29-c21 <> U11-C5T1 Data Latency : 40.2ns
U29-c21 <> U13-C6T1 Data Latency : 40.6ns
U29-c21 <> U15-C7T1 Data Latency : 39.4ns
U30-c22 <> U31-c23 Data Latency : 53.4ns
U30-c22 <> U1-C0T1 Data Latency : 43.9ns
U30-c22 <> U3-C1T1 Data Latency : 44.1ns
U30-c22 <> U5-C2T1 Data Latency : 44.4ns
U30-c22 <> U7-C3T1 Data Latency : 37.7ns
U30-c22 <> U9-C4T1 Data Latency : 39.3ns
U30-c22 <> U11-C5T1 Data Latency : 40.5ns
U30-c22 <> U13-C6T1 Data Latency : 40.6ns
U30-c22 <> U15-C7T1 Data Latency : 40.9ns
U31-c23 <> U1-C0T1 Data Latency : 43.8ns
U31-c23 <> U3-C1T1 Data Latency : 44.1ns
U31-c23 <> U5-C2T1 Data Latency : 44.7ns
U31-c23 <> U7-C3T1 Data Latency : 38.3ns
U31-c23 <> U9-C4T1 Data Latency : 38.5ns
U31-c23 <> U11-C5T1 Data Latency : 40.3ns
U31-c23 <> U13-C6T1 Data Latency : 41.1ns
U31-c23 <> U15-C7T1 Data Latency : 41.1ns
U1-C0T1 <> U3-C1T1 Data Latency : 31.5ns
U1-C0T1 <> U5-C2T1 Data Latency : 31.4ns
U1-C0T1 <> U7-C3T1 Data Latency : 30.8ns
U1-C0T1 <> U9-C4T1 Data Latency : 31.9ns
U1-C0T1 <> U11-C5T1 Data Latency : 32.5ns
U1-C0T1 <> U13-C6T1 Data Latency : 33.5ns
U1-C0T1 <> U15-C7T1 Data Latency : 33.8ns
U3-C1T1 <> U5-C2T1 Data Latency : 31.3ns
U3-C1T1 <> U7-C3T1 Data Latency : 31.3ns
U3-C1T1 <> U9-C4T1 Data Latency : 32.2ns
U3-C1T1 <> U11-C5T1 Data Latency : 33.2ns
U3-C1T1 <> U13-C6T1 Data Latency : 33.9ns
U3-C1T1 <> U15-C7T1 Data Latency : 33.5ns
U5-C2T1 <> U7-C3T1 Data Latency : 31.5ns
U5-C2T1 <> U9-C4T1 Data Latency : 32.1ns
U5-C2T1 <> U11-C5T1 Data Latency : 32.8ns
U5-C2T1 <> U13-C6T1 Data Latency : 33.7ns
U5-C2T1 <> U15-C7T1 Data Latency : 33.8ns
U7-C3T1 <> U9-C4T1 Data Latency : 28.4ns
U7-C3T1 <> U11-C5T1 Data Latency : 28.9ns
U7-C3T1 <> U13-C6T1 Data Latency : 29.7ns
U7-C3T1 <> U15-C7T1 Data Latency : 30.0ns
U9-C4T1 <> U11-C5T1 Data Latency : 29.5ns
U9-C4T1 <> U13-C6T1 Data Latency : 30.2ns
U9-C4T1 <> U15-C7T1 Data Latency : 30.9ns
U11-C5T1 <> U13-C6T1 Data Latency : 30.4ns
U11-C5T1 <> U15-C7T1 Data Latency : 31.3ns
U13-C6T1 <> U15-C7T1 Data Latency : 32.0ns
1x 64bytes Blocks Bandwidth : 12.32GB/s
4x 64bytes Blocks Bandwidth : 23.48GB/s
4x 256bytes Blocks Bandwidth : 96.68GB/s
4x 1kB Blocks Bandwidth : 370GB/s
4x 4kB Blocks Bandwidth : 867GB/s
16x 4kB Blocks Bandwidth : 552.64GB/s
4x 64kB Blocks Bandwidth : 615.07GB/s
16x 64kB Blocks Bandwidth : 608.81GB/s
8x 256kB Blocks Bandwidth : 621.77GB/s
4x 1MB Blocks Bandwidth : 189.22GB/s
16x 1MB Blocks Bandwidth : 44.66GB/s
8x 4MB Blocks Bandwidth : 42.93GB/s
Benchmark Status
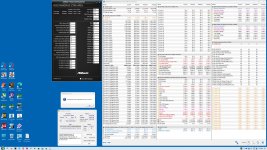
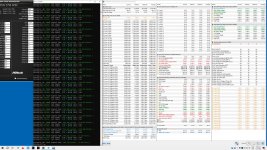
Result ID : Intel(R) Core(TM) i9-14900K (8C + 16c 32T 5.78GHz + 4.38GHz, 4.9GHz IMC, 8x 2MB + 4x 4MB L2, 36MB L3)
Microcode : 0B0671-11F
Computer : ASUS System Product Name (ASUS ROG MAXIMUS Z790 APEX)
Platform Compliance : x64
No. Threads : 32
System Timer : 10MHz
Page Size : 2MB
Processor
Model : Intel(R) Core(TM) i9-14900K
URL :
https://www.intel.com
Revision/Stepping : B7 / 1
Microcode : 0B0671-11F
Front-Side Bus Speed : 100MHz
Rated Power (TDP) : 150.00W
Min/Max/Turbo Power : N/A - 150.00W - 290.00W
Power/Current/Voltage Unlocked : Yes
big Cores Cluster
Cores per Processor : 8 Unit(s)
Threads per Core : 2 Unit(s)
Speed : 5.78GHz
Supported Speed(s) : 800MHz - 3.2GHz - 5.8GHz
Multiplier Unlocked : Yes
L1D (1st Level) Data Cache : 8x 48kB, 12-Way, Exclusive, 64bytes Line Size, 2 Thread(s)
L1I (1st Level) Code Cache : 8x 32kB, 8-Way, Exclusive, 64bytes Line Size, 2 Thread(s)
L2 (2nd Level) Unified/Data Cache : 8x 2MB, ECC, 16-Way, Exclusive, 64bytes Line Size, 8 Thread(s)
L3 (3rd Level) Unified/Data Cache : 36MB, ECC, 12-Way, Exclusive, 64bytes Line Size, 128 Thread(s)
Rated Voltage (DV) : 1.28V
Min/Max/Turbo Voltage : N/A - 1.28V
LITTLE cores Cluster
Cores per Processor : 16 Unit(s)
Speed : 4.38GHz
Supported Speed(s) : 800MHz - 3.2GHz - 4.4GHz
Multiplier Unlocked : Yes
L1D (1st Level) Data Cache : 16x 32kB, 8-Way, Exclusive, 64bytes Line Size, 2 Thread(s)
L1I (1st Level) Code Cache : 16x 64kB, 8-Way, Exclusive, 64bytes Line Size, 2 Thread(s)
L2 (2nd Level) Unified/Data Cache : 4x 4MB, ECC, 16-Way, Exclusive, 64bytes Line Size, 8 Thread(s)
L3 (3rd Level) Unified/Data Cache : 36MB, ECC, 12-Way, Exclusive, 64bytes Line Size, 128 Thread(s)
Rated Voltage (DV) : 1.30V
Min/Max/Turbo Voltage : N/A - 1.50V - 1.30V
Memory Controller
Speed : 4.9GHz
Min/Max/Turbo Speed : 800MHz - 4.9GHz
Performance Enhancing Tips
Warning 208 : Hybrid processor with big/LITTLE cores. Performance may vary with type of cores used.
Notice 241 : Dynamic OverClocking/Turbo enabled. Performance may vary when engaged.
Warning 205 : Turbo Power/Voltage/Current is low. Performance may be constrained.
Tip 3 : Double-click tip or press Enter while a tip is selected for more information about the tip.

")


 Noch nicht komplett optiomiert.

.png")